
I’ve often found that it’s much more effective to show clients what their problems are, rather than just telling them. Recently I’ve ended up using GraphViz as a great tool for high-lighting complexity that needs to be addressed.
At the client I’m currently working for the complexity of the build scripts was getting out of hand. I wanted to goad the customer into prioritising some simplification work. So I turned to GraphViz to depict how complex the build was. The build we’re using is a large, centralised, Ant script that builds about 10 different applications. It manages everything through the process of compile, test, package and deploy.
I found the handy ant2dot.xsl tool that uses XSL to transform an Ant build file into a DOT format graph representing the flow and dependencies between the various build targets.
Before
The picture that emerged was pretty shocking:
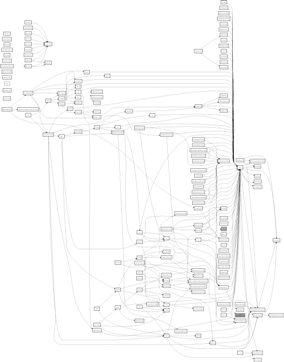
Even printed out on the largest paper the client’s printer could handle you still couldn’t even read the target names. Images of the Flying Spaghetti Monster kept jumping into my mind. But the tactic worked and when I showed the client the picture in our Iteration Planning Meeting they were quick to prioritise some work to simplify the build process.
After
After a month or so of gradual re-structuring and simplification I repeated the visualisation exercise to see how we were doing. The results were pretty striking:
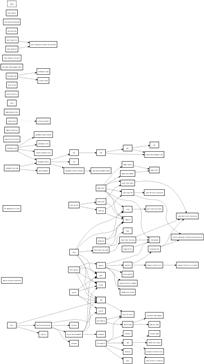
Needless to say the pictures told more than a thousand words could: the client was happy, we had a neater picture to help developers understand how the build scripts worked AND the builds were simpler.
Cool, thanks for the link.
You also have http://vizant.sourceforge.net/ , http://www.ggtools.net/grand/ and http://www.yworks.com/en/products_antexplorer_about.htm